Jul 28, 2023
Understanding a SIEM
SIEM, or Security Information and Event Management, operates like a vigilant security camera for an organization's computer network. It continuously monitors all digital actions and promptly alerts the team if it spots anything unusual. Besides immediate threats, SIEM tools also help dissect past security events to understand and prevent them in the future. For businesses that have to adhere to specific security regulations, SIEM ensures they're on track, consolidating data from various sources for a comprehensive view. This central hub not only automates responses to familiar threats but also recognizes recurring patterns to bolster future defenses. In essence, SIEM is an indispensable tool that oversees, understands, and aids in refining a company's digital security measures.
Why Azure Sentinel?
Azure Sentinel, Microsoft's cloud-native SIEM solution, has emerged as a game-changer in cybersecurity. With its ability to seamlessly scale in the cloud, it offers not just threat detection but deep insights into these threats, enabling a proactive defense stance. Its integration with the broader Microsoft ecosystem, combined with potent automation capabilities, streamlines security processes and ensures rapid responses to vulnerabilities in a controlled environment.
What we'll learn
In this walkthrough, based on Josh Madakor's guide, we'll delve into the capabilities of Azure Sentinel, Microsoft's cloud-native SIEM service. We'll navigate through setting up Azure, managing remote access and logs, collecting and analyzing threat data, visualizing threat patterns, and observing real-time cyberattacks from global locations. By the end, learners will have hands-on experience with Azure Sentinel, understanding its practical applications in cybersecurity and threat management.
Introduction to Azure Sentinel:
Azure Sentinel is Microsoft's cloud-based SIEM (Security Information and Event Management) solution, designed to provide vast security analytics and threat intelligence. It's a tool that helps organizations detect, investigate, and respond to security threats.
The Role of Honeypots in Cybersecurity:
Honeypots are decoy systems or networks designed to lure cyber attackers, helping security professionals study their methods and develop defenses against them. They act as bait, capturing valuable information on potential threats.
PowerShell in Cybersecurity:
PowerShell is a task automation framework from Microsoft. In cybersecurity, it's used for scripting to automate tasks, analyze data, and sometimes by attackers as a tool for exploitation. Understanding its functionalities is crucial for both defense and offense.
Geolocation of Cyber Threats:
By determining the geographic location of a threat actor or a compromised system, organizations can gain deeper insights into potential threat patterns, origins, and even motivations. Tools and scripts can be used to trace IP addresses to specific locations.
Integrating Virtual Machines with Azure Sentinel:
Linking VMs to Azure Sentinel allows for real-time monitoring of potential threats to these virtual systems. The integration ensures that any suspicious activity on the VM can be quickly analyzed and acted upon.
Visualizing Threat Data:
Visualization tools, like Azure Sentinel's map, provide a graphical representation of security data, making it easier to spot patterns, trends, and anomalies. This can be crucial for rapid threat detection and response.
Content
Azure Setup:
Establish an Azure Subscription.
Set Up a Virtual Machine.
Open All Access in Firewall.
Initiate Log Analytics Workspace.
Activate VM log collection in Microsoft Defender for Cloud.
Link Log Analytics to the Virtual Machine.
Initialize Azure Sentinel.
Remote Access and Logs:
Access VM using Remote Desktop (miss first login attempt).
Review VM's Event Viewer Logs.
Disable VM's Windows Firewall.
Data Collection & Analysis:
Download the PowerShell Script.
Obtain Geolocation.io API Key.
Execute Script for Geo Data from assailants.
Develop a custom log in LAW for our specific records.
Designate custom fields/derive data from the original custom log.
Test Data Extractions.
Visualization:
Implement a geographical map in Sentinel using Latitudes and Longitudes.
Adjust Map Plot Dimensions.
Observing Attacks:
Azure Setup
Establish an Azure Subscription.
Create a Free Azure Microsoft account here.
You will have to put credit card info, but you will have up to $200 of free credit which is more than enough for this lab.
Make sure to stop your virtual machine when you are not using it to avoid wasting credit.
Delete the honeypotlab resource group when you are done with the lab.
Set Up a Virtual Machine.
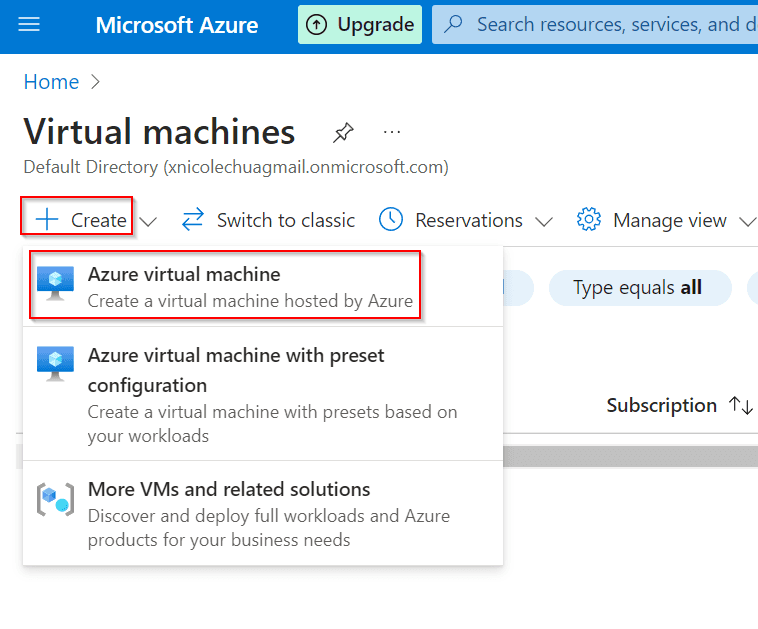
Go to the main portal.
Select Virtual Machines.
Go to create > Azure virtual machine.
Basics
Create a resource group named Honeypotlab
Virtual Machine name: honeypot-vm
Region: (US) west US 3
Availability Options: No infrastructure redundancy required.
Security Type: Standard
Image: Windows 10 Pro
Size: Standard Free
Create your username and password
Public inbound ports: Allow Selected Ports
Select inbound ports: RDP (3389)
Disks
Default Settings
Networking
NIC network security group: Advanced
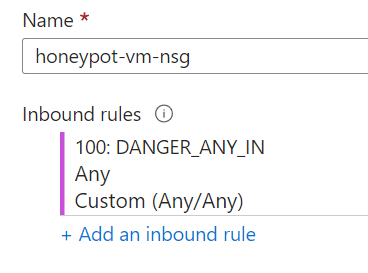
Configure network security group > Create new > Remove inbound default rule > Add inbound default rule > Destination port ranges: * (Allows all traffic) > Protocol: Any > Action: Allow > Priority: 100 > Name: DANGER_ANY_IN.
Management
Default
Advanced
Default
Tags
Default
Review + Create
Review the virtual machine
Make sure your deployment is successful

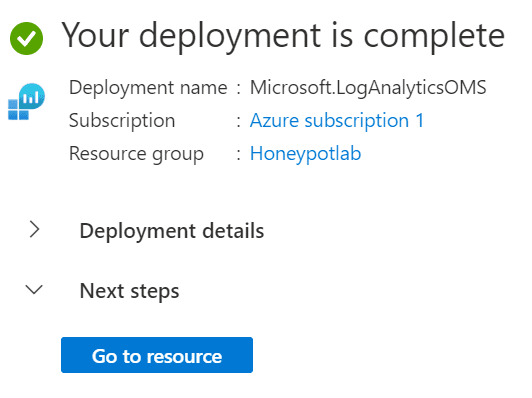
Initiate Log Analytics Workspace.
Navigate to Log Analytics Workspace
Create Log Analytics workspace
Resource group: honeypotlab
Name: law-honeypotlab
Region: US West 3
Review + Create
Activate VM log collection in Microsoft Defender for Cloud.
Navigate to Microsoft Defender for Cloud
Click Upgrade for the 30 day free trial plan
Navigate to Management > Environment Settings
Select law-honeypot
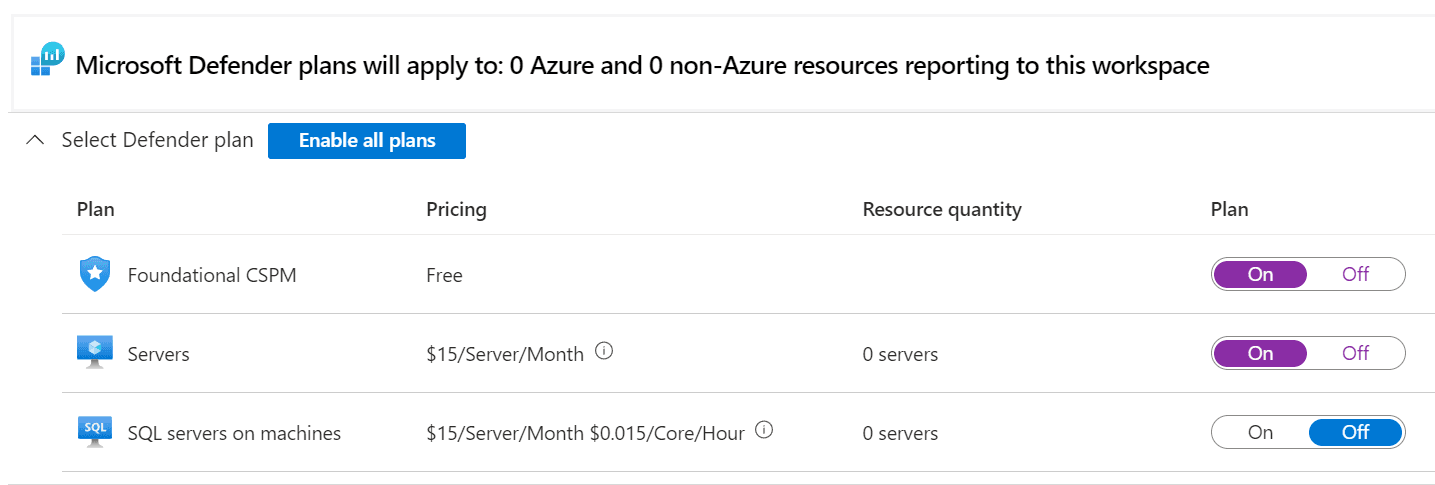
Defender Plans: Enable all plans, but remove SQL servers on machines. Click Save.
Data Collection: All Events. Click Save.

Link Log Analytics to the Virtual Machine.
Navigate to Log Analytics Workspace
Select law-honeypotlab
Navigate to Classic > virtual machines
Click honeypot-vm
Click Connect
Initialize Azure Sentinel.
Navigate to Microsoft Sentinel
Create Microsoft Sentinel
Choose law-honeypotlab
Remote Access and Logs
Access VM using Remote Desktop (miss first login attempt).
Navigate to Virtual Machines.
Select honeypot-vm.
Copy your public IP address.
Navigate to Remote Desktop Connection on your own computer.
Paste your public IP address that you copied into computer and hit connect.
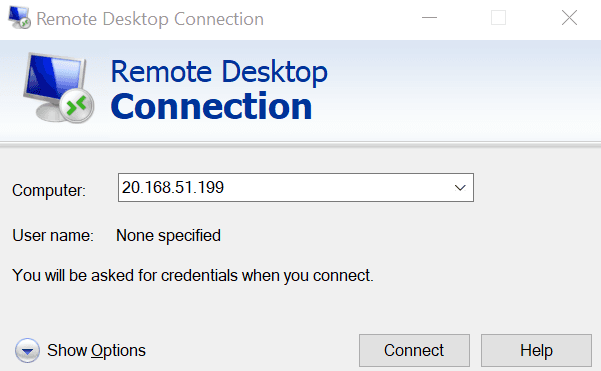
login using your credentials you created when making the VM. (Fail it once and we can view the log in event viewer)
Choose no on all privacy settings.
Setup Microsoft Edge.
Review VM's Event Viewer Logs.
Navigate to Event Viewer within your VM
Select Windows Logs > Security > Audit Failure
You will notice unknown username or bad password as the reason
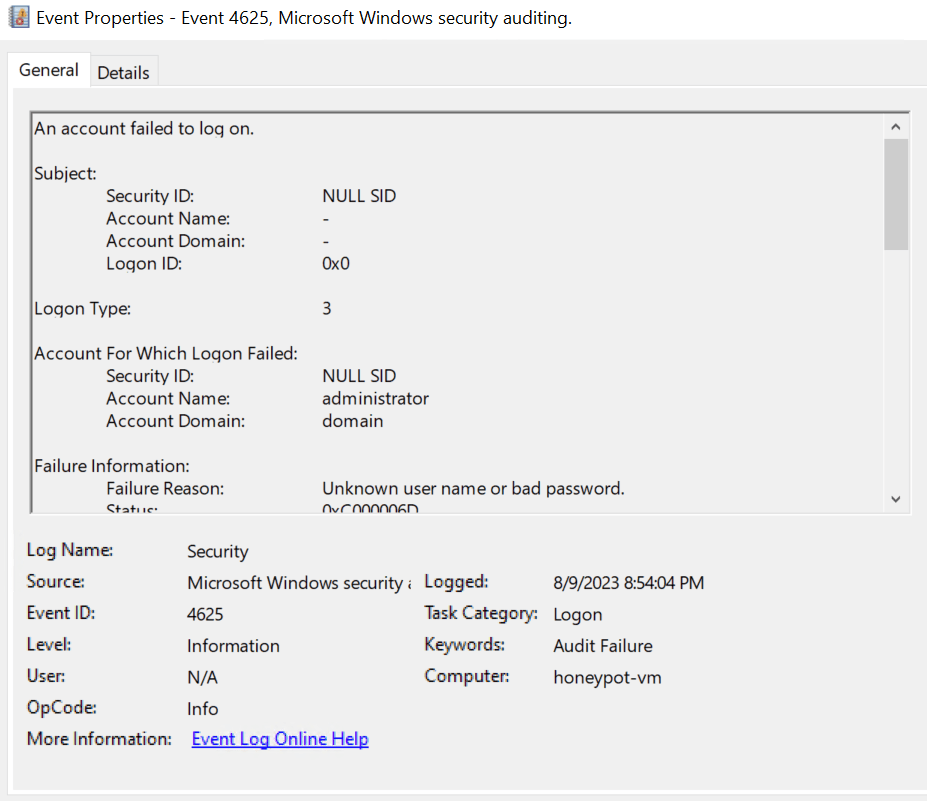
Disable VM's Windows Firewall.
Go to your own computer and open Command Prompt.
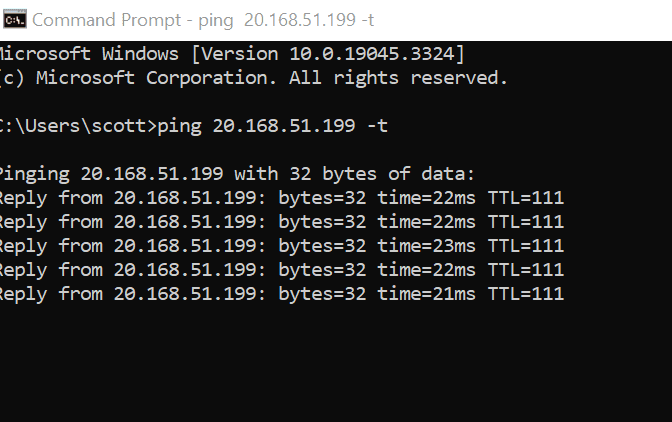
Type ping (your virtual machine IP Address) -t
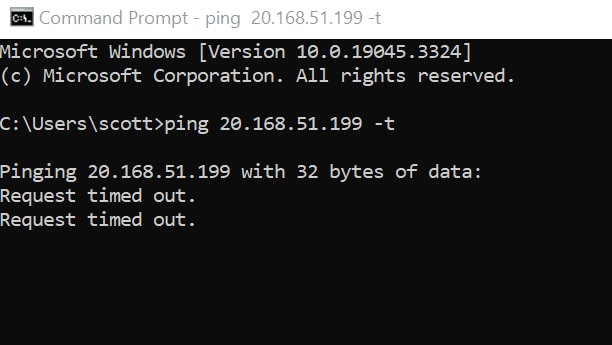
Go to virtual machine and navigate to windows firewall.

Navigate to Windows Defender Firewall with Advanced Security on Local computer > Right click properties > turn off all Firewall states in each tab. Click OK.
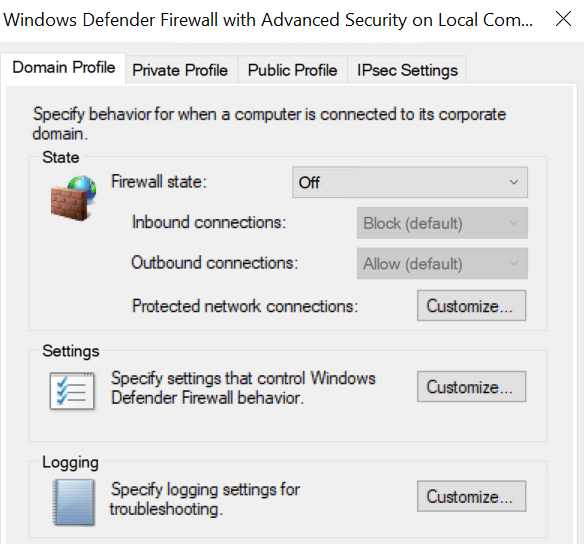
View the ping reply working in command prompt.
Data Collection & Analysis
Download the PowerShell Script.
Navigate to Windows PowerShell ISE in the VM.
Select New Script
Paste the Script and Save. Name it Log_Exporter and place it on the Desktop.
Obtain Geolocation.io API Key.
Sign up for an account.
Get your API key.
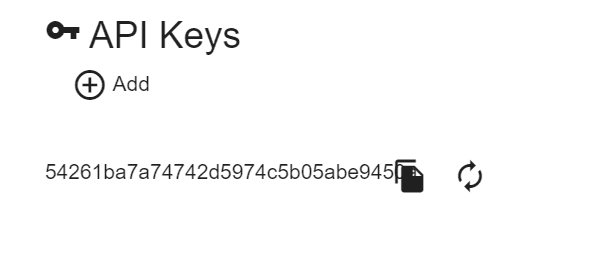
Paste your API key in your script inside Windows Powershell ISE.
Execute Script for Geo Data from assailants.
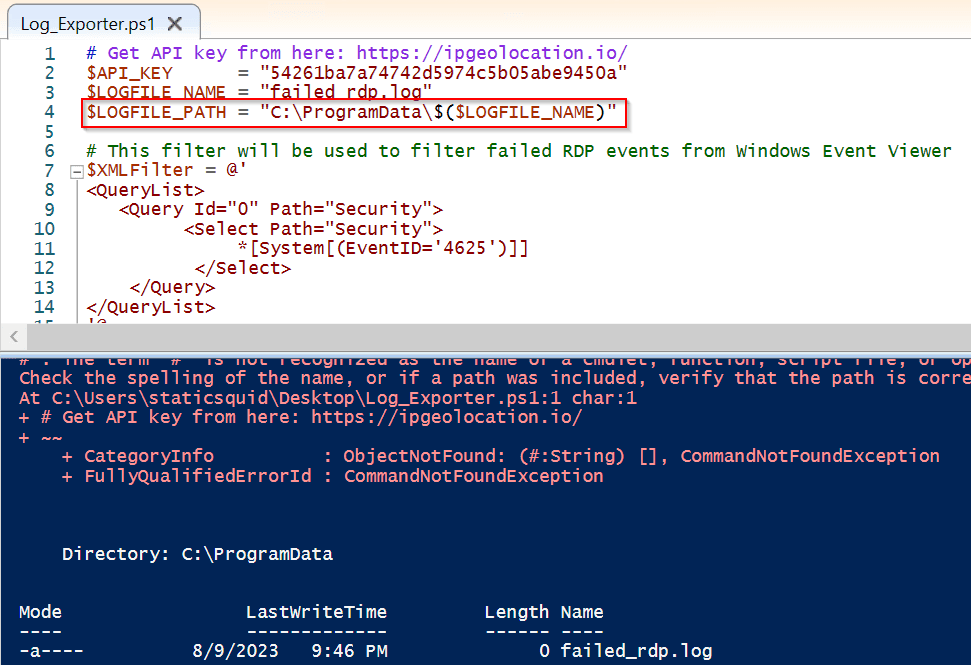
Click Run and you can view the failed logons.
Logs will be saved here.
Develop a custom log in LAW for our specific records.
Navigate to Log Analytics workspaces in Azure.
Select law-honeypotlab
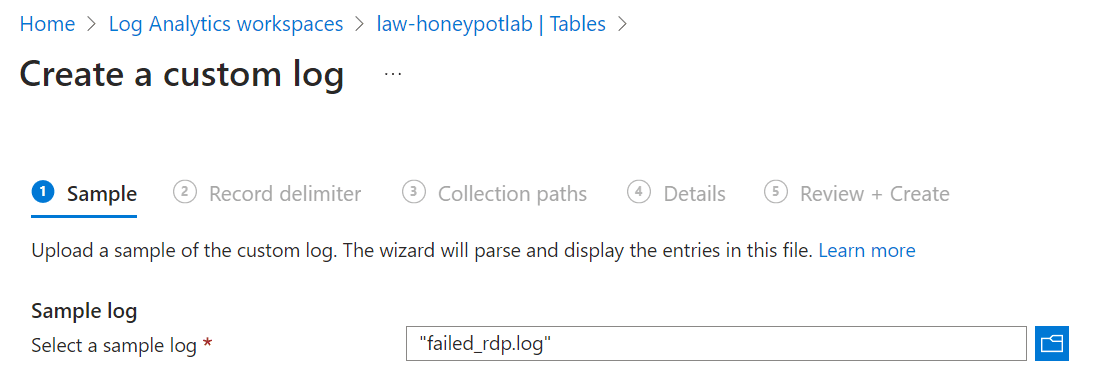
Go to Tables> Create a custom log (MMM-based).
Go to VM and enter windows+R and navigate to ProgramData.
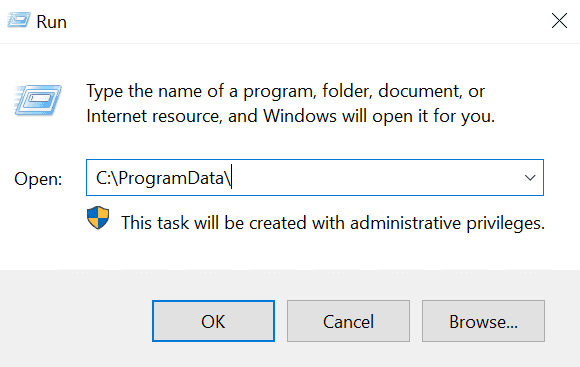
Open failed_rdp and copy the contents to a new file on notepad on your own computer. Save it as failed_rdp.log

Go back to Azure and select the failed_rdp.log
Record delimiter default settings
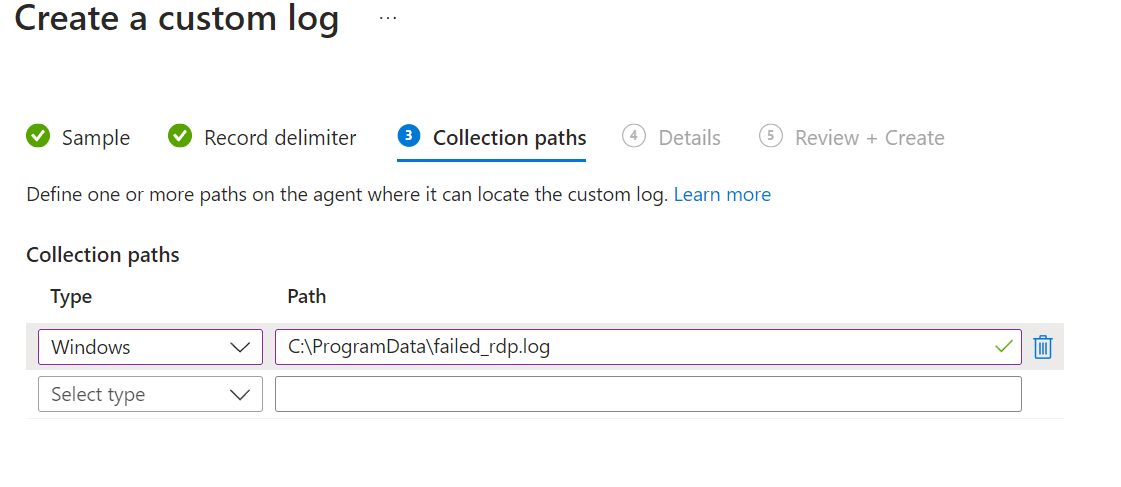
Collection paths: Select Windows and the Path from the VM.
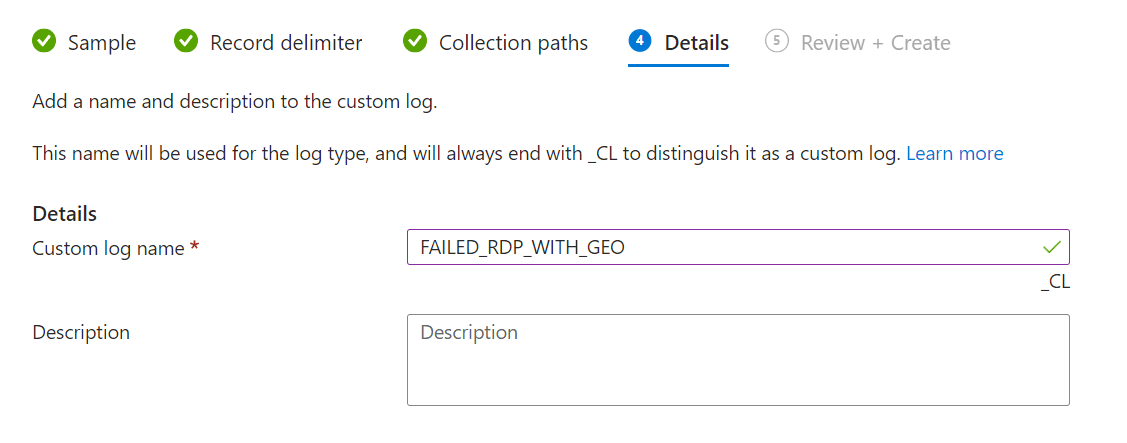
Details: Make custom log name FAILED_RDP_WITH_GEO
To check go to log > New query > FAILED_RDP_WITH_GEO (It will take time to sync)

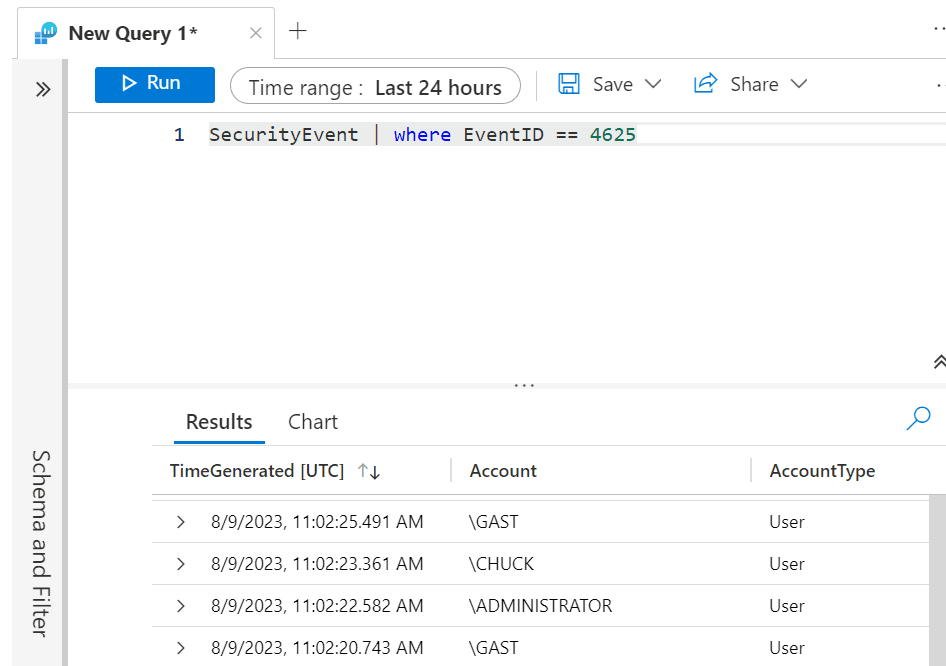
You can also check the Event Viewer logs and filter the failed login attempts by running: SecurityEvent | where EventID == 4625
Designate custom fields/derive data from the original custom log.
Enter:
FAILED_RDP_WITH_GEO_CL | extend username = extract(@"username:([^,]+)", 1, RawData), timestamp = extract(@"timestamp:([^,]+)", 1, RawData), latitude = extract(@"latitude:([^,]+)", 1, RawData), longitude = extract(@"longitude:([^,]+)", 1, RawData), sourcehost = extract(@"sourcehost:([^,]+)", 1, RawData), state = extract(@"state:([^,]+)", 1, RawData), label = extract(@"label:([^,]+)", 1, RawData), destination = extract(@"destinationhost:([^,]+)", 1, RawData), country = extract(@"country:([^,]+)", 1, RawData) | where destination != "samplehost" | where sourcehost != "" | summarize event_count=count() by timestamp, label, country, state, sourcehost, username, destination, longitude, latitude.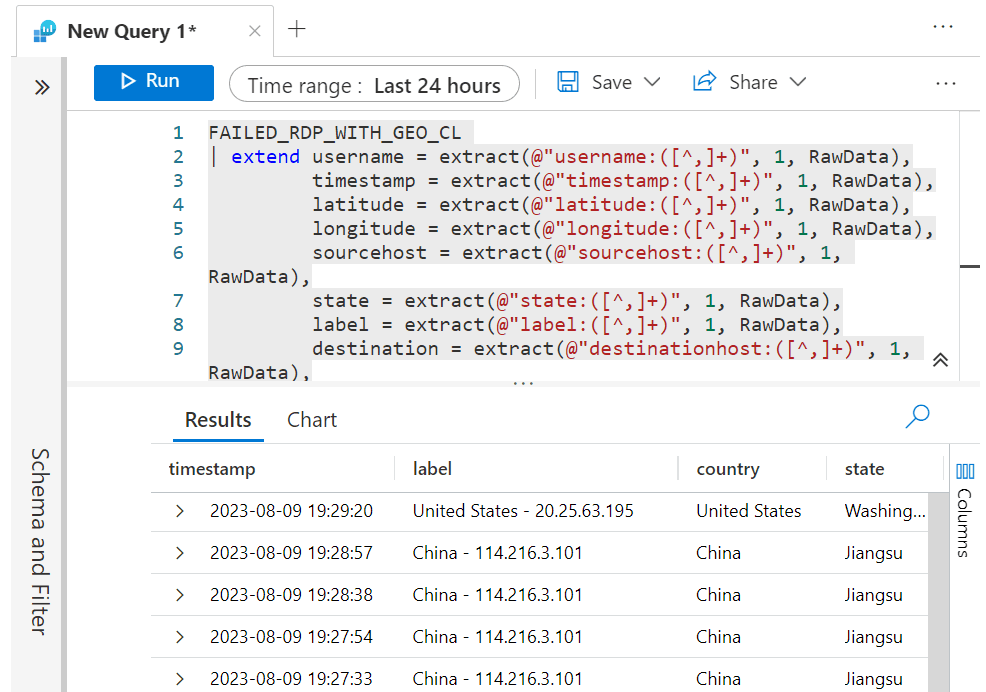
Visualization
Implement a geographical map in Sentinel using Latitudes and Longitudes.
Navigate to Microsoft Sentinel
Go to workbooks > Add new workbook > Edit and remove the two default widgets.
Click Add > Add a query
Enter:
FAILED_RDP_WITH_GEO_CL | extend username = extract(@"username:([^,]+)", 1, RawData), timestamp = extract(@"timestamp:([^,]+)", 1, RawData), latitude = extract(@"latitude:([^,]+)", 1, RawData), longitude = extract(@"longitude:([^,]+)", 1, RawData), sourcehost = extract(@"sourcehost:([^,]+)", 1, RawData), state = extract(@"state:([^,]+)", 1, RawData), label = extract(@"label:([^,]+)", 1, RawData), destination = extract(@"destinationhost:([^,]+)", 1, RawData), country = extract(@"country:([^,]+)", 1, RawData) | where destination != "samplehost" | where sourcehost != "" | summarize event_count=count() by latitude, longitude, sourcehost, label, destination, countrySelect Map under Visualization.
Go to Map settings
Change Metric Label > Label
Metric Value > event_count
Click Run Query.

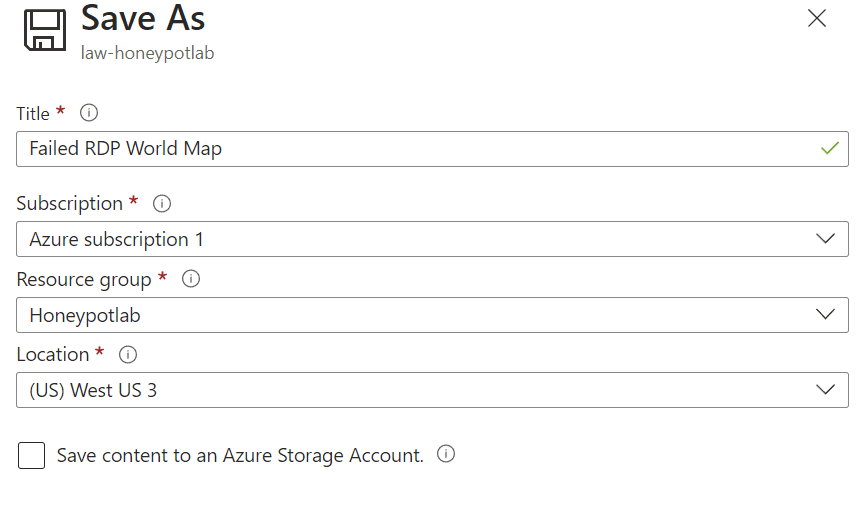
Save the workbook Failed RDP World Map.
Observing Attacks

Summary and Final thoughts
To begin, we set up a virtual machine to serve as our honeypot. After its setup, we then adjusted its firewall settings specifically to permit all incoming traffic, aligning with this lab's specific objectives. Once that was in place, we established a custom log analytics workspace. This workspace was crucial, as it was designed to record the Windows event logs that provide insights into the geographic origins of potential attackers.
With our logs set to capture the relevant details, Azure Sentinel (our SIEM) was then linked to this workspace. This connection is pivotal as it allows us to project and visualize our captured data onto a map, making analysis more intuitive. Moving forward, we harnessed the capabilities of Microsoft Defender for Cloud. By doing so, we enabled the seamless collection of logs from the virtual machine directly into our log analytics workspace.
As an added measure to make our honeypot more enticing and discoverable, we made further adjustments to the firewall. This change ensured our virtual machine would respond to ICMP requests, essentially allowing it to be detected online. After setting the stage, it didn't take long to observe failed login attempts. Recognizing this, our final stride involved integrating this invaluable data with Azure Sentinel. By pairing the data with geolocations, we were able to create a comprehensive visual representation of the attack origins and patterns.
Wrapping up, this lab shows how important it is to see and practice against real threats, even in a safe setup. Using Azure Sentinel in this way helps us understand how to handle real-world cyber issues. As online threats keep changing, tools like Azure Sentinel are crucial for spotting and dealing with them. This hands-on experience teaches us not just the tech side, but also how important it is to stay alert and prepared against cyber threats. In the end, being prepared and knowing what to do is our best protection.